The yield of a harvest is the result of months or years of growth of your agricultural and forestry plants. Many years of experience with our highly precise yield models have taught us which factors determine the increase or decrease of crop quantities and qualities.

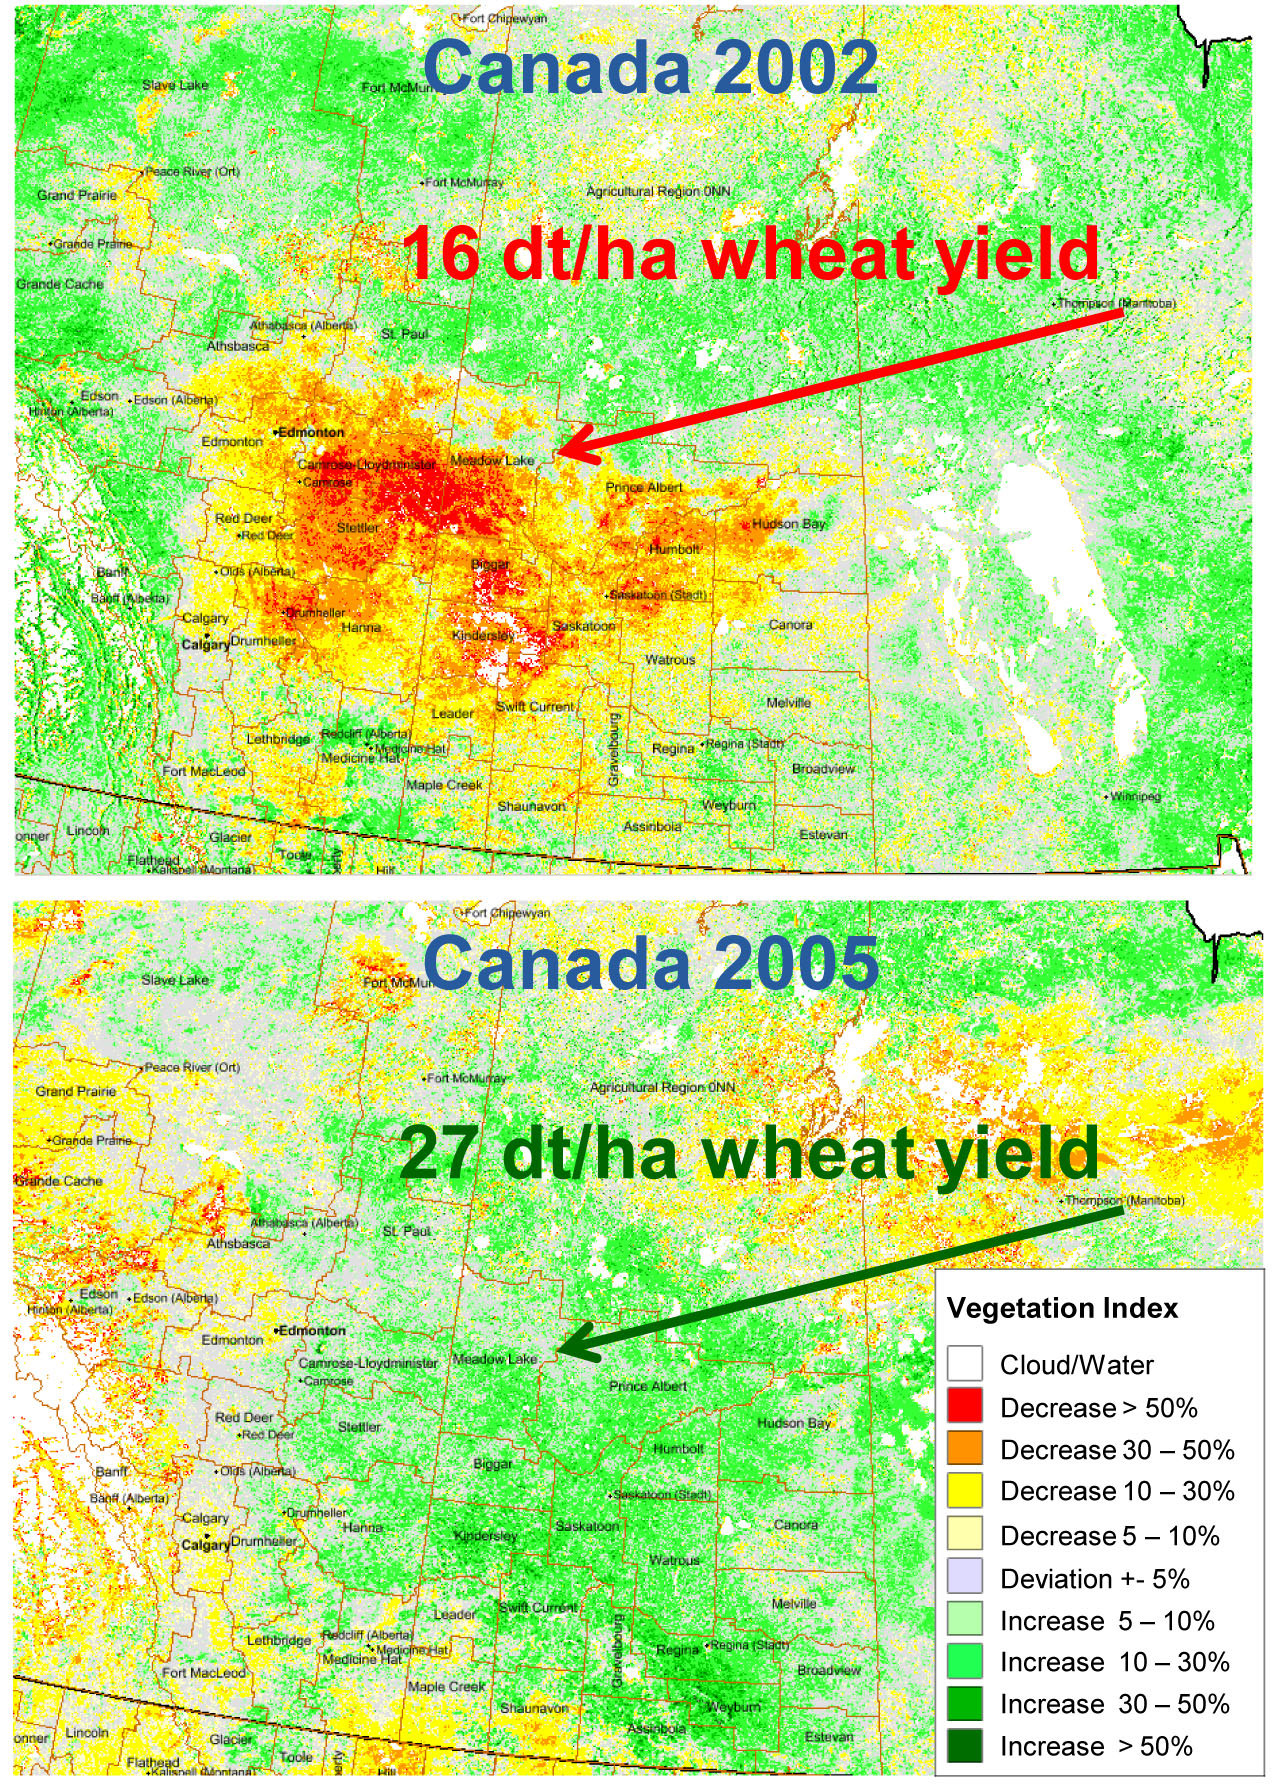
Regions in Canada with drought-induced biomass and consequential yield loss in 2002 compared to 2005, measured by satellites.
Different locations are subject to different yield-relevant influences at different points in time: Old farmers’ rules don’t
simply hold independent of location.
Satellite imagery and data from our archives of the past decades provide us with an insight into the location-specific prerequisites of the cultivation process. We use this data as a basis to evaluate the situation at hand and for an outlook onto future developments.
With our satellite images from our archives, we can see on which areas the plants grow weaker year by year, and where they steadily perform the best.
Risk maps detailing the occurrence of plant diseases and droughts, generated from satellite, soil and weather data, specify those areas where the yield could be in danger and to which degree.
We combine different types of data and integrate it into our successful models, in order to examine a location with regard to the opportunities and risks for a high yield.
